Portfolio Analytics
The Portfolio workspace connects to your IBKR account to provide analytics across your ETF positions. It answers the question: "What do my ETFs actually make me own?"
Requirements
- IBKR TWS or IB Gateway running with API enabled (see IBKR Setup)
- At least one open position in your account
Views
Overview
Portfolio summary: total market value, cash, net liquidation, and position count. This is your starting point to confirm the connection is working and see your account at a glance.
Positions
All current positions with market value, unrealized P&L, and portfolio weight. Weight is calculated as market_value / net_liquidation × 100.
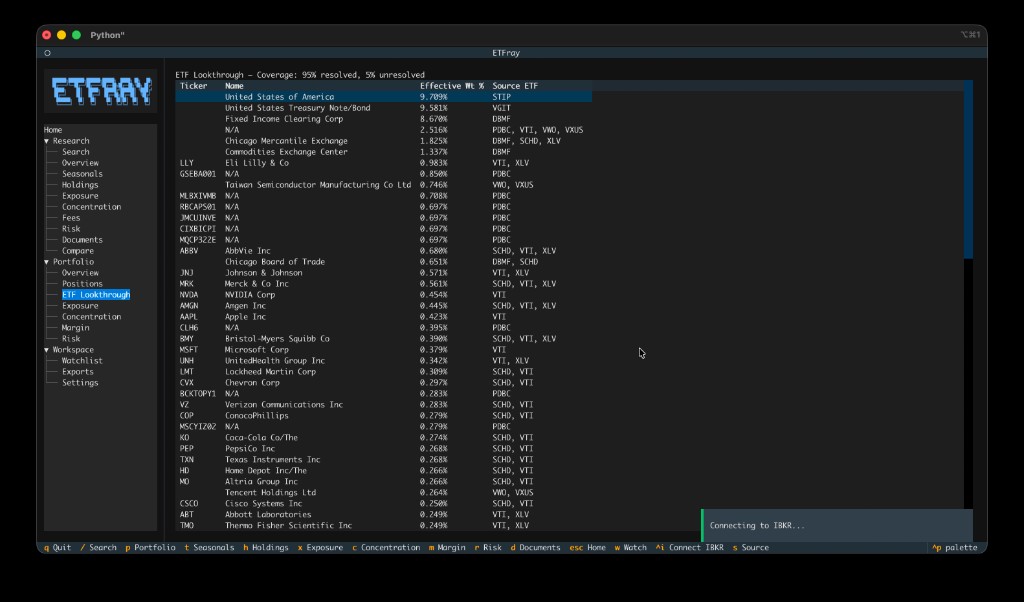
Lookthrough
Decomposes your ETF positions into their underlying holdings. This is the core analytical feature of the Portfolio workspace.
The math:
effective_weight = portfolio_weight_of_ETF × holding_weight_in_ETF
Example: If your portfolio is:
- VTI: 60% of portfolio
- QQQM: 40% of portfolio
And Apple (AAPL) is:
- 6.5% of VTI
- 8.8% of QQQM
Then your effective Apple exposure is:
(0.60 × 6.5%) + (0.40 × 8.8%) = 3.9% + 3.5% = 7.4% of your portfolio
This reveals that even a "diversified" two-fund portfolio can have significant single-stock concentration.
What "Source ETF" means: Each lookthrough holding shows which of your ETFs contribute to that exposure. If Apple appears in both VTI and QQQM, you'll see Source ETF: VTI, QQQM.
Unresolved ETFs
If etfray can't find holdings data for one of your positions (e.g., a non-ETF stock, or an ETF without available filings), it appears in the "unresolved" list. The lookthrough still works for your other ETFs — unresolved positions are simply excluded from the decomposition.
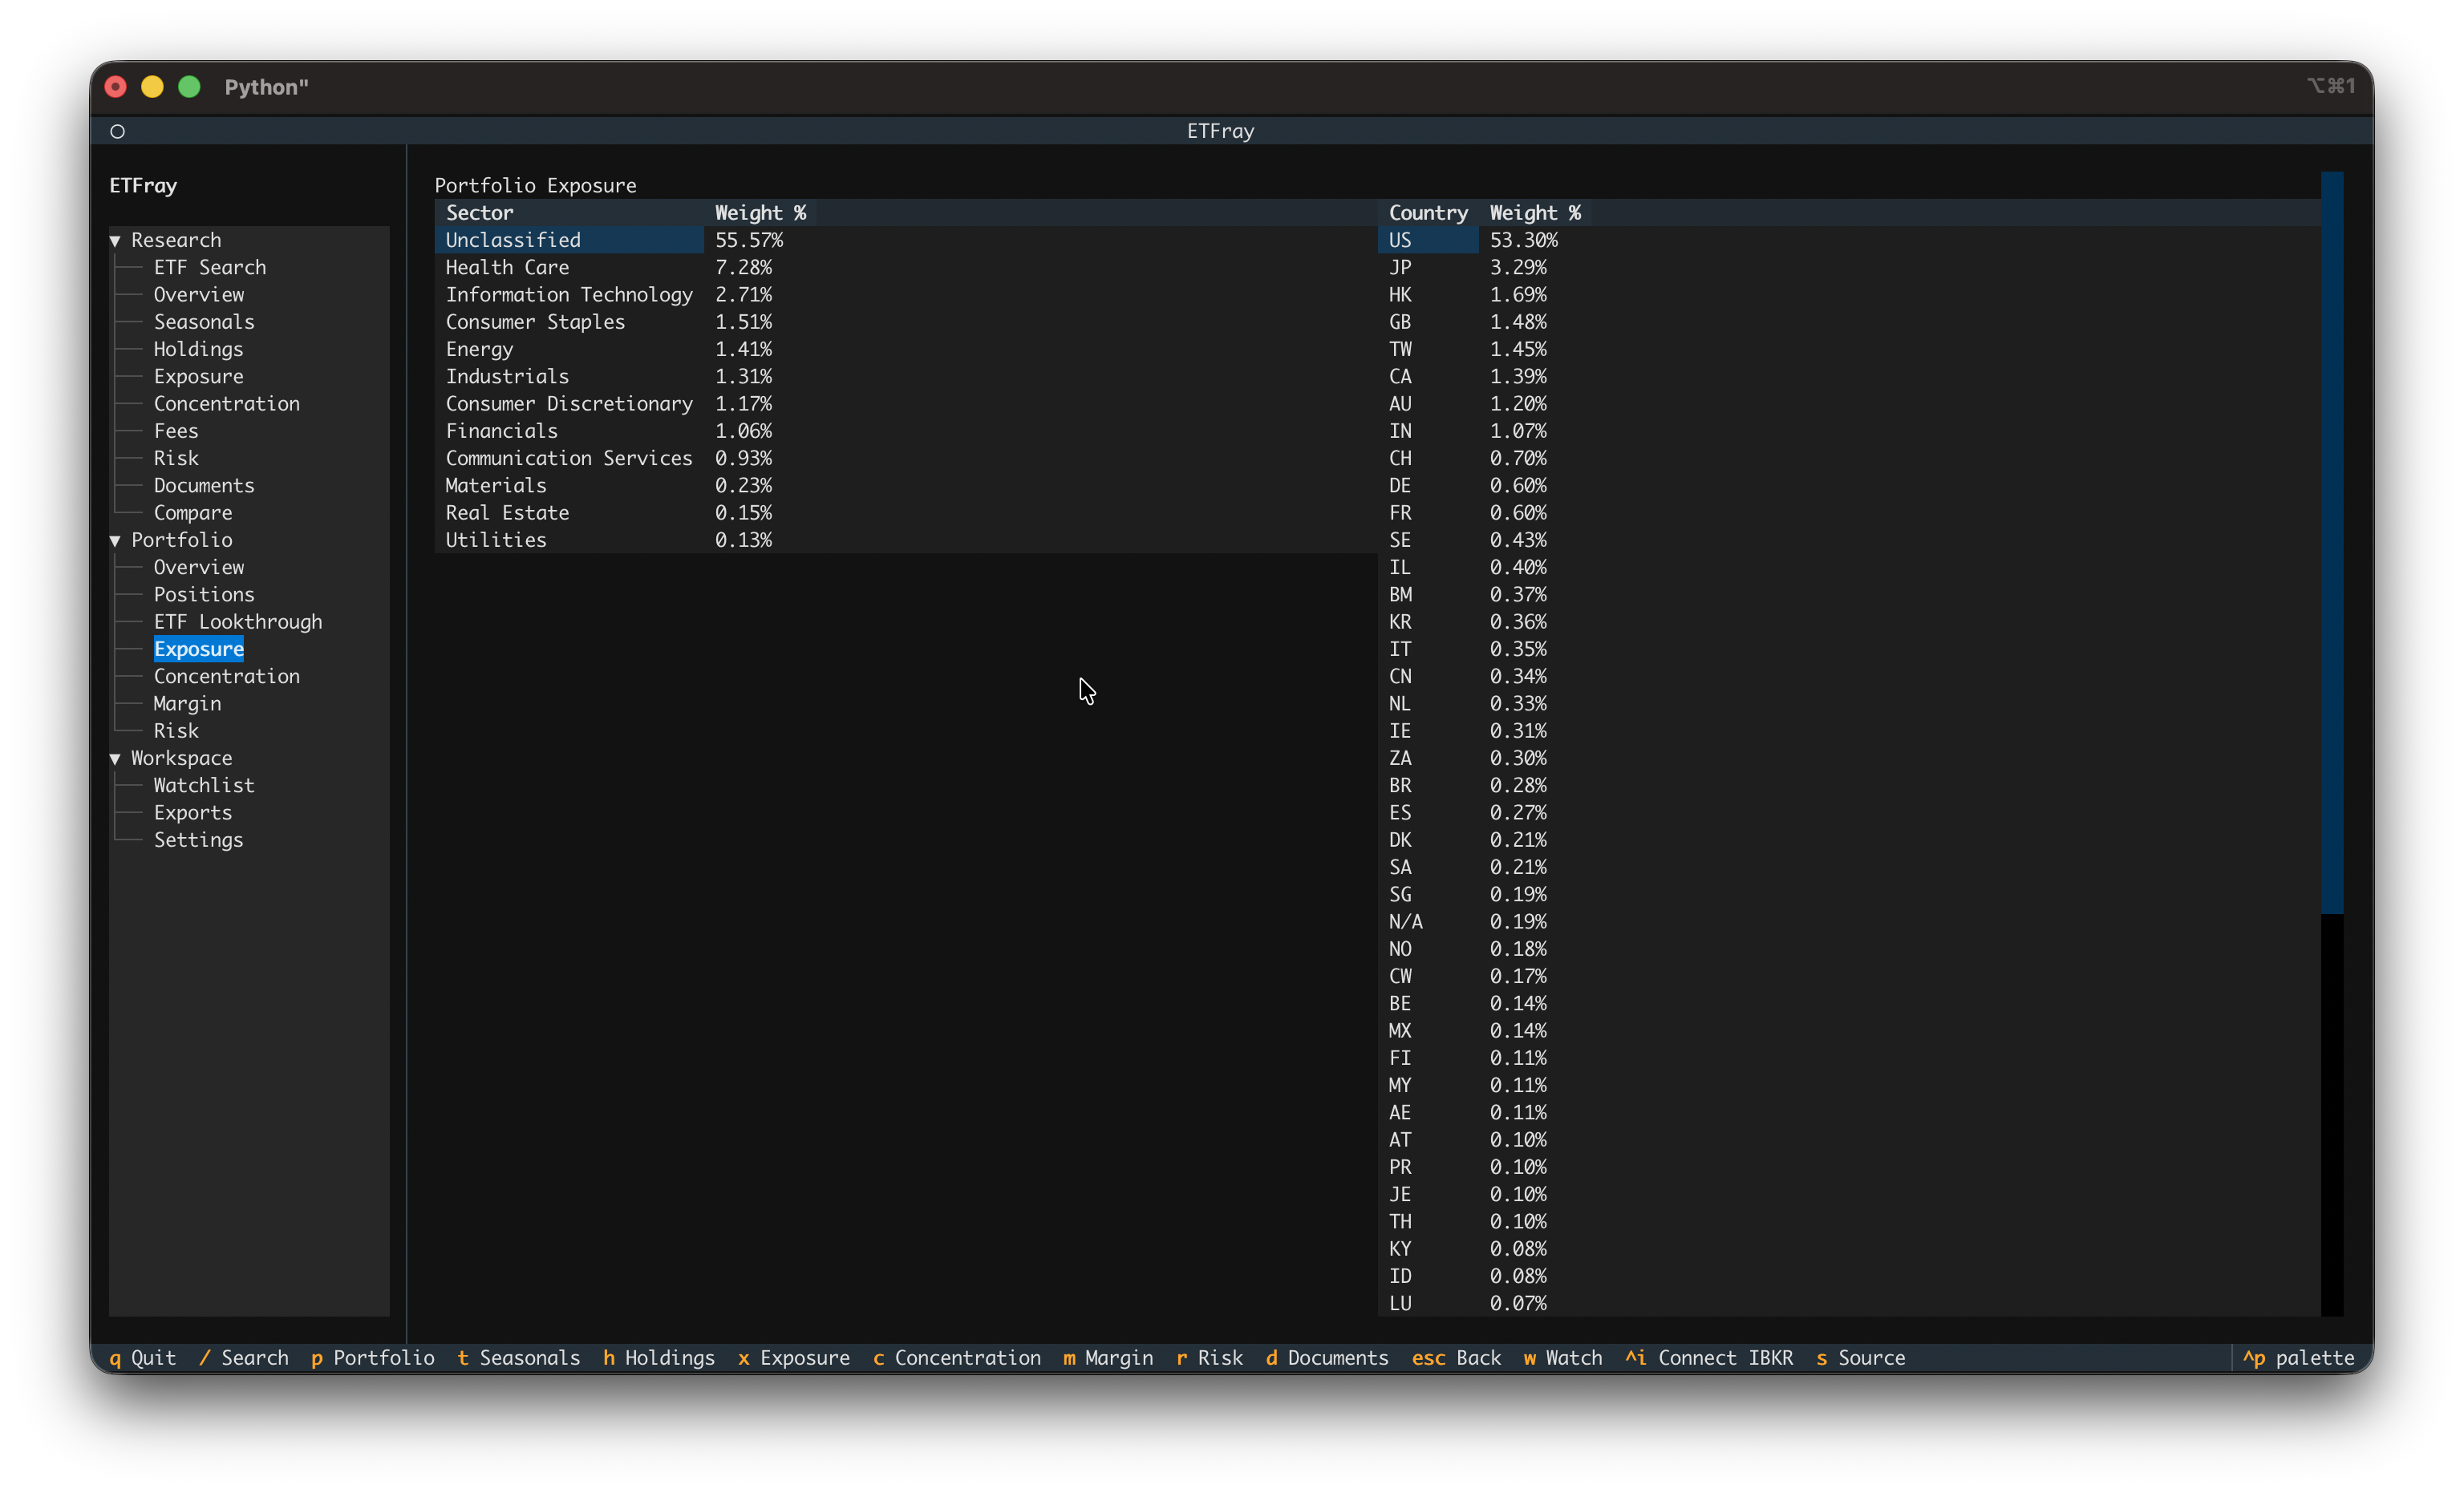
Exposure
Aggregated sector and geographic exposure across all portfolio ETFs, weighted by position size. Unlike the Research exposure view (which shows a single ETF), this combines all your holdings into one picture.
What to look for:
- Unintended sector bets — Holding VTI + QQQ + SMH might give you 50%+ in Technology without realizing it
- Geographic concentration — Multiple US ETFs means your "diversified" portfolio might be 95% US equities
Concentration
Portfolio-level concentration analysis at the underlying stock level. Shows how concentrated your combined holdings are after lookthrough decomposition.
This uses the same HHI and effective-N metrics as the Research concentration view, but applied to your actual portfolio. A portfolio with effective N of 40 behaves like holding 40 equal-weight stocks, regardless of how many ETFs you own.
Key insight: Owning 5 ETFs doesn't guarantee diversification. If they all hold the same mega-cap stocks, your effective concentration may be much higher than expected.
ETF-level overlap detection:
etfray computes pairwise Jaccard overlap between each pair of ETF positions in your portfolio and scores the result:
| Score | Meaning |
|---|---|
| High | Most positions hold significantly overlapping underlying stocks — combining them provides minimal diversification benefit |
| Medium | Moderate overlap — some diversification benefit, but also meaningful redundancy |
| Low | Positions have few common underlying holdings — genuinely diversified at the stock level |
Ticker normalization
etfray normalizes ticker symbols before comparing them across ETFs. Spaces and slashes are stripped (e.g., BRK B and BRK/B both compare as BRKB). This prevents the same underlying stock from being counted as two different holdings due to formatting differences across data sources.
Margin
Margin utilization, buying power, maintenance margin, and leverage ratio. This view is critical if you use margin.
Metrics explained:
| Metric | Formula | What it means |
|---|---|---|
| Leverage ratio | Gross position value / Net liquidation | How much exposure you have relative to equity. 1.0 = no margin, 2.0 = 2x leveraged |
| Cushion | Excess liquidity / Net liquidation | Buffer before a margin call. 0.15 = 15% buffer remaining |
| Excess liquidity | Net liquidation − Maintenance margin | Dollar amount above the margin call threshold |
| Buying power | Available funds for new positions | How much more you can buy on margin |
| SMA | Special Memorandum Account | Regulatory credit balance; not equity |
Warning thresholds:
- Leverage warning fires when leverage ratio exceeds the configured threshold (default: 2.0×)
- Cushion warning fires when cushion drops below the configured threshold (default: 15%)
- Cash warning fires when cash balance is negative (borrowed beyond equity)
Stress Scenarios:
The Margin view includes a Stress Scenarios section that simulates what happens to your cushion if the portfolio declines:
| Scenario | What is computed |
|---|---|
| −10% shock | New cushion assuming gross position value drops 10%, with net liquidation reduced by the same amount |
| −20% shock | Same calculation for a 20% drawdown |
For each scenario, etfray shows the projected cushion percentage and flags it in red if it would breach your configured margin_warning_cushion threshold. This helps you identify how much of a drawdown you can absorb before approaching a margin call, without waiting for it to happen.
Example: If your current cushion is 25% and the −10% scenario shows 12% (below the 15% warning threshold), you know a 10% market drop would trigger a warning — giving you time to reduce exposure proactively.
Warning
Margin warnings are informational — etfray does not place trades or modify your account. If you see warnings, evaluate your positions in TWS/Gateway directly.
Risk
Portfolio risk metrics including concentration risk, single-name exposure, leverage warnings, equity exposure, and data coverage. This combines insights from Concentration and Margin into a single risk dashboard.
Risk metrics:
| Metric | Description |
|---|---|
| Leverage Risk | High (>2×), Medium (>1.5×), or Low based on current leverage ratio |
| Margin Risk | High (cushion <10%), Medium (cushion <20%), or Low |
| Equity Exposure % | Percentage of lookthrough holdings classified as equity (asset type EC or Equity). Useful for understanding how much of your portfolio is truly in stocks vs bonds, commodities, or other asset classes |
| Concentration Risk | High (top-10 effective weight >30%), Medium (>15%), or Low |
| Data Coverage | Full — all positions resolved to holdings; Partial — most positions resolved; Low — fewer than half of positions could be resolved to holdings data |
Risk Drivers: The view shows a dynamic list of only the risk issues currently active. If leverage is low, cushion is healthy, and coverage is full, the drivers list will be short. A long list indicates multiple simultaneous risk factors.
What to watch:
- Single-name exposure above 5% (hidden concentration via multiple ETFs)
- Leverage ratio trending upward (market moves can increase leverage even without new trades)
- Low cushion combined with concentrated positions (worst-case scenario for margin calls)
- Low Data Coverage means the Concentration and Equity Exposure metrics are incomplete — resolve by opening the unresolved ETFs in Research to fetch their holdings