Tutorial: Finding Hidden Overlap Between ETFs
This tutorial walks through using etfray to discover how much two ETFs overlap — and whether holding both actually adds diversification.
The Problem
You hold VTI (US Total Market) and QQQ (Nasdaq-100). They sound different, but how much do they actually overlap? If the overlap is high, one of them may be redundant.
What is Overlap?
etfray calculates weight-adjusted overlap: for every stock that appears in both ETFs, it takes the minimum of the two weights and sums them up.
overlap = Σ min(weight_in_A, weight_in_B) for all shared tickers
An overlap of 40% means that 40% of each fund's weight is invested in the same stocks at similar proportions.
Interpretation guide:
| Overlap | Meaning |
|---|---|
| 0–20% | Minimal overlap — funds are complementary |
| 20–50% | Moderate overlap — some redundancy but still diversifying |
| 50–80% | High overlap — limited diversification benefit from holding both |
| 80–100% | Near-identical — one fund is largely redundant |
Steps
1. Look up the first ETF
Press /, type VTI, and press Enter. Browse the Holdings view to get a sense of the fund — ~3,700 holdings, cap-weighted, with Apple/Microsoft/Nvidia at the top.
2. Look up the second ETF
Press /, type QQQ, and press Enter. QQQ has ~100 holdings, also cap-weighted but limited to Nasdaq-listed stocks. The top holdings look similar to VTI's.
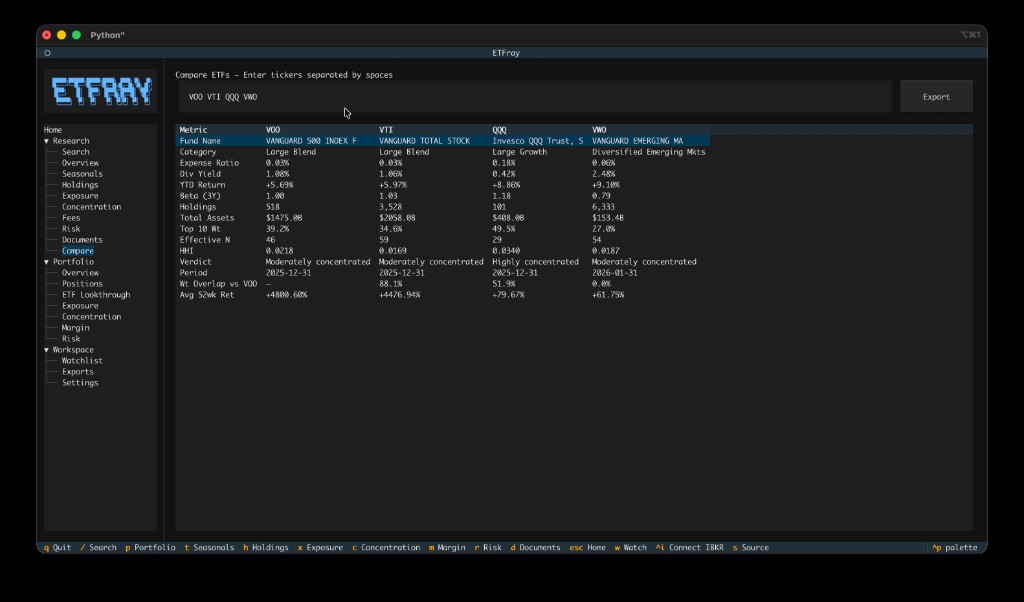
3. Use the Compare view
Navigate to the Compare view. Add both VTI and QQQ to see them side by side. The overlap percentage is displayed directly.
4. Interpret the results
For VTI vs QQQ, you'll typically see:
- Overlap: ~40–45% — This means about 40% of QQQ's weight is in stocks that are also in VTI at similar weights.
- Shared top holdings: Apple, Microsoft, Nvidia, Amazon, Meta — all appear in both funds.
- What QQQ adds: Higher concentration in tech mega-caps. QQQ's top 10 is ~55% of the fund vs VTI's ~30%.
5. Draw conclusions
A 40% overlap means QQQ does add some differentiation (it's more concentrated in tech), but there's significant redundancy. If you hold 60% VTI + 40% QQQ, you're effectively overweighting Nasdaq tech stocks relative to the total market.
Alternative to consider: If you want tech tilt, you could hold 100% VTI and accept the market-weight tech exposure, or hold VTI + a sector ETF like XLK for a more intentional tilt.
Other Useful Comparisons
| Pair | Typical Overlap | Insight |
|---|---|---|
| VTI vs ITOT | ~99% | Nearly identical — pick whichever has lower fees |
| VTI vs AVUV | ~5% | Minimal overlap — AVUV adds small-cap value exposure |
| VTI vs VXUS | ~0% | No overlap — US vs international, fully complementary |
| QQQ vs XLK | ~70% | High overlap — both are tech-heavy, limited benefit from both |
| VTI vs VOO | ~85% | Very high — VTI contains all of VOO plus small/mid caps |
Next Steps
- Check your actual portfolio overlap using the Portfolio Lookthrough view
- See the Three-Fund Analysis tutorial for a full portfolio evaluation