Home Dashboard
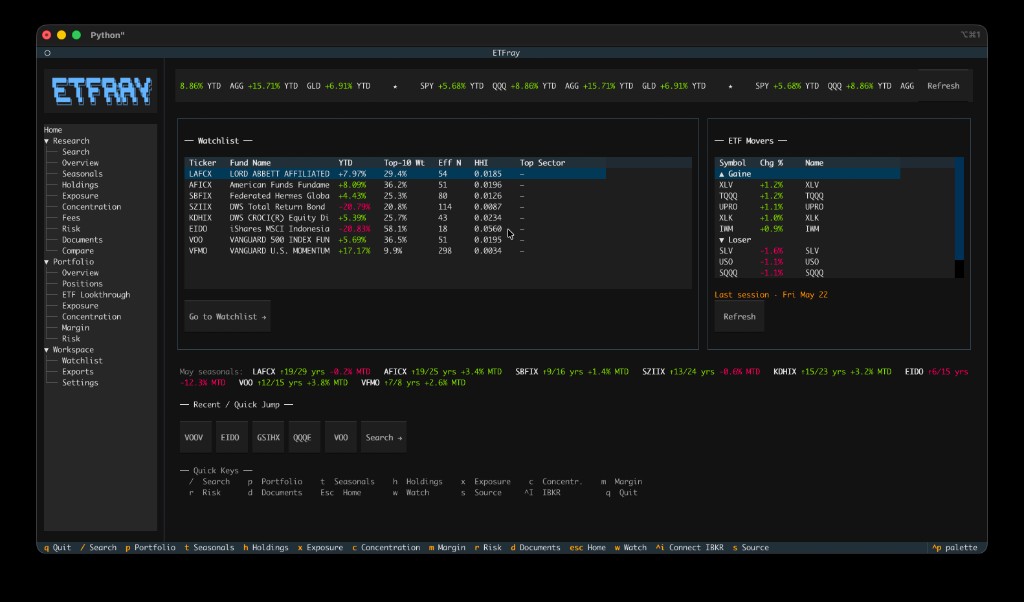
The Home screen is the first thing you see when etfray starts. It gives you a live snapshot of what matters most — benchmark performance, what's moving today, your watchlist at a glance, and seasonal context for the current month — without needing to navigate anywhere.
Press Esc at any time to return to the Home screen from any view.
Benchmark Marquee
The top bar shows a horizontally scrolling ticker with the YTD return for four key benchmarks:
| Ticker | Asset Class |
|---|---|
| SPY | US Large-Cap Equity |
| QQQ | US Nasdaq-100 |
| AGG | US Aggregate Bonds |
| GLD | Gold |
Returns are color-coded: green for positive, red for negative. The marquee pauses automatically when you hover over it with your mouse.
Click the Refresh button on the right to force a fresh fetch from Yahoo Finance. The cache TTL for fund profiles is 7 days, so Refresh is useful if you know data has been updated.
Note
Benchmark data is sourced from Yahoo Finance via yfinance. The marquee is populated in a background thread at startup — if it shows "loading…" briefly, that is normal.
Watchlist Snapshot
The left panel shows a compact summary of every ETF in your watchlist. This lets you monitor your tracked funds at startup without opening each one.
Columns:
| Column | Description |
|---|---|
| Ticker | ETF ticker symbol |
| Fund Name | Full fund name (truncated to 25 characters) |
| YTD | Year-to-date return from Yahoo Finance profile |
| Top-10 Wt | Cumulative weight of the 10 largest holdings |
| Eff N | Effective N (1 / HHI) — the equivalent number of equal-weight holdings |
| HHI | Herfindahl-Hirschman Index — concentration score (lower = more diversified) |
| Top Sector | The highest-weight sector found in the holdings data |
Interaction:
- Single-click a row to select it.
- Double-click a row to navigate directly to that ETF's Overview in the Research workspace.
- Click Go to Watchlist → to open the full Watchlist view with all columns and management controls.
Tip
The YTD and concentration metrics are populated from cached data. If a cell shows —, either the ETF has not been opened yet (no cache) or Yahoo Finance data was not available at last fetch. Opening the ETF in Research will populate the cache.
ETF Movers
The right panel shows the top-5 ETF daily gainers and losers by day-change percentage.
Data source
Movers are sourced from Yahoo Finance's screener queries (most_actives, gainers, losers). The screener runs across thousands of instruments; etfray filters to quoteType == "ETF" only and de-duplicates by symbol. Results are cached in SQLite with a 1-hour TTL.
Seed-universe fallback: When the Yahoo screener returns fewer than 10 ETFs (which can happen outside US market hours or during API rate-limiting), etfray automatically falls back to a curated seed universe of 40+ well-known ETFs:
- Broad equity: SPY, QQQ, IWM, DIA, VTI, IVV, VOO
- Factor/style: VUG, VTV, IJR, MTUM
- Fixed income: TLT, AGG, HYG, LQD, SHY, BND
- Commodities: GLD, SLV, USO, IAU
- International: EEM, EFA, VEA, VWO
- Sectors: XLF, XLK, XLE, XLV, XLI, XLY, XLB, XLU, XLC, XLRE
- Leveraged: TQQQ, SQQQ, UPRO, SPXU
The seed universe uses a 5-day batch yf.download() call to compute overnight day-change percentages.
Staleness indicator
A small status line below the movers table indicates when the data is from:
- Dim text ("today · 3m ago") — Data is from today's trading session; this is the normal state during or just after market hours.
- Yellow text ("Last session · Fri May 23") — The most recent trade timestamp in the data is older than 24 hours. This is expected overnight and on weekends. The data still reflects the last session's close correctly.
Interaction
- Single-click a row to select it.
- Double-click a row (gainers or losers) to navigate directly to that ETF in Research.
- Click Refresh to force a new fetch regardless of the 1-hour cache TTL.
Note
Section header rows ("▲ Gainers" and "▼ Losers") cannot be clicked — only the data rows navigate.
Seasonal Spotlight
The strip below the main panels shows the current month's seasonal context for each ticker in your watchlist. This surfaces the most time-relevant data from the Seasonals view directly on the home screen.
Format: SPY ↑9/15 yrs +1.2% MTD
| Component | Meaning |
|---|---|
↑9/15 yrs |
This month has closed higher in 9 of the last 15 years (60% win rate) |
+1.2% MTD |
Month-to-date return for the current (possibly partial) month |
Colors follow the same convention as the rest of the app: green for positive/bullish, red for negative/bearish.
The spotlight is computed from the local SQLite price history cache. If no price history exists for a watchlist ticker, it is omitted from the strip. Open that ETF's Seasonals view at least once to populate the cache.
Recent / Quick-Jump
Below the Seasonal Spotlight, a row of pill buttons shows the last 5 ETFs you visited, plus a "Search →" pill that takes you directly to ETF Search.
- Pressing any ticker pill navigates directly to that ETF's Overview.
- The "Search →" pill is equivalent to pressing
/. - The list is maintained automatically as you open ETFs — no configuration required.
Quick Keys Footer
The bottom of the Home screen shows a compact keybinding reference. All of these work from any view in the app (not just Home):
| Key | Action |
|---|---|
/ |
ETF Search |
p |
Portfolio overview |
t |
Seasonals view |
h |
Holdings view |
x |
Exposure view |
c |
Concentration view |
m |
Margin view |
r |
Risk view |
d |
Documents view |
Esc |
Return to Home |
w |
Add current ETF to watchlist |
s |
Cycle data source (auto → edgar → web) |
^I |
Connect to IBKR |
q |
Quit |
See Keybindings for the full reference.
Startup Behavior
At startup, etfray loads the Home screen with the following sequence:
- Splash screen — Initializes the database, loads settings, attempts IBKR auto-connect, and warms the ETF series/class cache.
- Home screen mounts — All four panels begin loading concurrently in background workers.
- Benchmark marquee — Fetched in a daemon thread from Yahoo Finance (uses 7-day profile cache).
- Watchlist snapshot — Loads from the local SQLite cache (no network if data is fresh).
- ETF Movers — Loaded from the 1-hour screener cache, or fetched from Yahoo Finance if the cache is expired.
- Seasonal Spotlight — Computed from the local price-history cache after the watchlist loads.
- Recent pills — Loaded from the
notestable in the SQLite database.
The Home screen is fully usable before all panels finish loading — populated panels appear as soon as their workers complete.